
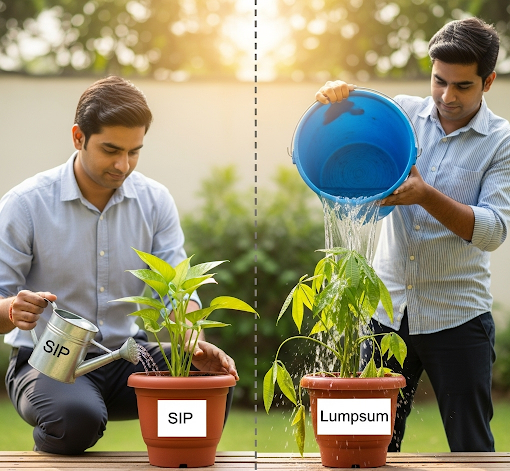
SIP vs Lumpsum
— Which is Better?
When SIP beats lumpsum, when lumpsum wins, the STP middle path, rupee cost averaging explained, and how to decide the right approach based on your financial situation and market conditions.
The SIP vs Lumpsum Question
Every investor who receives a bonus, inheritance, PF withdrawal, or property sale proceeds faces this question: should I invest everything immediately (lumpsum) or spread it out monthly (SIP)? The honest answer is: it depends on market conditions, your psychological profile, and your investment horizon. This guide gives you a clear framework to decide — and introduces the STP hybrid approach that often provides the best outcome for most investors.
How SIP and Lumpsum Work
| Feature | SIP (Systematic Investment Plan) | Lumpsum |
|---|---|---|
| Investment pattern | Fixed amount monthly over time | One-time entire amount at once |
| Best for | Salary earners; volatile markets; risk-averse investors | One-time windfall; clearly cheap market; high risk tolerance |
| Entry point risk | Low — averaged across multiple market levels | High — single entry determines outcome significantly |
| Rupee Cost Averaging | Yes — buys more units when markets fall | No — fixed entry price |
| Psychological comfort | High — no timing anxiety | Lower — fear of investing at peak |
| Compounding start | Gradual — full corpus builds over time | Immediate — full corpus compounding from day one |
Mathematical Reality — When Each Wins
A back-tested analysis of SIP vs lumpsum in Nifty 50 over rolling 5-year periods shows:
- Lumpsum beats SIP in approximately 55-60% of all 5-year periods
- SIP beats lumpsum in approximately 40-45% of all 5-year periods
- The advantage is most pronounced: lumpsum wins strongly in early-bull-market entry; SIP wins strongly in high-valuation or pre-crash entry
- Over 15+ years, the gap narrows significantly — both approaches tend toward similar outcomes
The mathematical edge goes slightly to lumpsum for very long horizons, but the psychological reality is that most investors who make large lumpsum investments at market peaks panic and exit during the subsequent correction — permanently destroying the advantage that the lumpsum approach would theoretically provide.
Rupee Cost Averaging — SIP’s Core Advantage
When you invest Rs 10,000 monthly regardless of NAV, you automatically buy more units when markets fall and fewer when markets rise. This reduces your average cost per unit below the average NAV over the period.
| Month | SIP Amount | NAV | Units Bought |
|---|---|---|---|
| Jan (high) | Rs 10,000 | Rs 120 | 83.3 |
| Feb (correction) | Rs 10,000 | Rs 90 | 111.1 |
| Mar (low) | Rs 10,000 | Rs 80 | 125.0 |
| Apr (recovery) | Rs 10,000 | Rs 100 | 100.0 |
| May (rise) | Rs 10,000 | Rs 115 | 87.0 |
| Total | Rs 50,000 | Average NAV: Rs 101 | 506.4 units |
Average SIP cost per unit = Rs 50,000 / 506.4 = Rs 98.74 — below the average NAV of Rs 101. This is Rupee Cost Averaging. The lumpsum investor who invested Rs 50,000 in January at Rs 120 NAV owns only 416.7 units — fewer than the SIP investor despite investing the same amount.
The STP Strategy — Best of Both Worlds
For anyone with a lump sum to invest, Systematic Transfer Plan (STP) is often the optimal approach:
- Invest the full lump sum into a liquid mutual fund (earns 6.5-7.5% while waiting)
- Set up an STP to transfer a fixed amount monthly from the liquid fund to the equity fund of your choice
- Typically spread over 6-18 months depending on market conditions and comfort
Benefits of STP: full capital earns liquid fund returns immediately (better than leaving in savings account); equity deployment is spread over time (Rupee Cost Averaging benefit); automated — no manual action each month; and psychologically comfortable — no anxiety about timing the entire investment.
Example: Rs 5 lakh windfall → invest in liquid fund immediately → STP of Rs 50,000/month for 10 months to equity fund. The undeployed Rs 4.5-5 lakh earns 7% (liquid) while Rs 50,000 enters equity monthly.
Real Return Comparison — Long Term
| Strategy | Amount | Period | Result at 12% CAGR |
|---|---|---|---|
| SIP Rs 10,000/month | Rs 24 lakh total | 20 years | Rs 99.9 lakh |
| Lumpsum Rs 24 lakh | Rs 24 lakh total | 20 years | Rs 2.32 crore |
| Lumpsum Rs 2 lakh/year | Rs 24 lakh total | 20 years | Rs 1.61 crore |
Lumpsum wins mathematically when the full capital is invested from the start and at the same interest rate. In practice, most people do not have Rs 24 lakh sitting idle to invest — they earn Rs 10,000 monthly and SIP is the only realistic strategy. For the salary earner, SIP is not a second choice — it is the only choice.
SIP vs Lumpsum Decision Framework
| Your Situation | Recommended Approach |
|---|---|
| Monthly salary, no large lump sum | SIP — the only practical option |
| Windfall (bonus, FD maturity, property sale) + markets at normal/high levels | STP — liquid fund → monthly equity transfer over 12-18 months |
| Windfall + markets clearly cheap (Nifty PE below 15-17) | 50% lumpsum now + 50% SIP over 6 months |
| Windfall + 15+ year horizon + high risk tolerance | Full lumpsum if psychologically prepared for interim volatility |
| ELSS tax saving | Always SIP — monthly Rs 12,500 from April, never March lumpsum rush |
SIP vs Lumpsum Checklist
- If you have a regular salary: set up SIP and increase annually
- If you have a windfall to invest: use STP (liquid fund to equity over 12 months)
- Never attempt to time the market — start immediately in either mode
- For ELSS: always SIP from April rather than March lumpsum
- Use the SIP Calculator and Lumpsum Calculator to compare both approaches for your specific amount and time horizon
- For goals beyond 10 years, the entry method matters far less than consistency of investment
🧮 Free Calculators — Use Them Now
No login required. Updated for FY 2025-26.
Frequently Asked Questions
Neither SIP nor lumpsum consistently outperforms the other in all conditions. In a rising market (bull run), lumpsum invested at the start outperforms SIP because the full amount is invested early and compounds for the entire period. In a volatile or falling market, SIP outperforms lumpsum because Rupee Cost Averaging (buying more units at lower prices during dips) reduces average purchase cost. Over very long periods (15-20 years) with multiple market cycles, the performance gap narrows significantly. The practical conclusion: for investors with a lump sum available, a combination (30-40% immediate lumpsum + 60-70% SIP over 12-18 months) often provides the best risk-adjusted outcome.
Lumpsum outperforms SIP in consistently rising markets where there are few corrections. If markets go from 10,000 to 25,000 in a smooth upward trajectory over 5 years, a lumpsum investor who put in all money at 10,000 has full exposure throughout and earns maximum returns. The SIP investor puts money in at 10,000, 11,000, 12,000… 24,000 — averaging a much higher entry price. Lumpsum is therefore better when: markets are clearly cheap (low PE, post-correction); you have a long horizon (15+ years reduces entry point significance); and you have the psychological discipline not to panic and exit during interim volatility.
SIP outperforms lumpsum when markets are volatile or in a declining phase. In a volatile market that ends roughly where it started after 3-5 years (a sideways market), SIP investors benefit significantly from buying more units during dips and fewer during rises — their average cost is lower than the average market level. SIP also wins for investors without a lump sum (most salary earners create wealth through monthly income). Psychologically, SIP is superior for most retail investors — it removes the fear of investing at the wrong time and enforces disciplined investing through market cycles.
Research generally shows that investing a lump sum immediately outperforms spreading it over time in the long run (because markets historically trend upward and every day you are out of the market costs expected returns). However, the real-world psychological risk of investing a large amount at a market peak and then watching it fall 20-30% causes many investors to exit at the worst possible time. A practical compromise: invest 50% immediately (capturing immediate market exposure) and invest the remaining 50% via SIP over 12 months (Systematic Transfer Plan from liquid fund to equity fund). This balances mathematical optimality with psychological sustainability.
A Systematic Transfer Plan (STP) is a strategy where you invest a lump sum in a liquid or debt fund and then automatically transfer a fixed amount to an equity fund every month. Example: invest Rs 5 lakh in a liquid fund, then transfer Rs 50,000 per month for 10 months to a flexi-cap equity fund. This strategy: earns liquid fund returns (6.5-7%) on the uninvested portion while deploying into equity systematically; avoids the risk of putting all money into equity at potentially poor timing; maintains psychological comfort by spreading the equity deployment; and is fully automated with no monthly manual action required. STP is the recommended approach for investing a windfall or bonus into equity mutual funds.
For ELSS tax saving, SIP throughout the year is significantly better than a lump sum in March (the common mistake). SIP throughout the year: averages entry price across different market levels; spreads the 3-year lock-in unlock across 12 months per year; avoids the March rush where investors invest without evaluating the fund; and benefits from Rupee Cost Averaging. The common mistake: realising in March that Rs 1.5 lakh is needed to complete 80C and making a one-time lump sum investment. This results in a single high entry risk and all units unlocking in one batch after 3 years (less flexibility). Start ELSS SIP in April at Rs 12,500/month and maintain it year-round.