
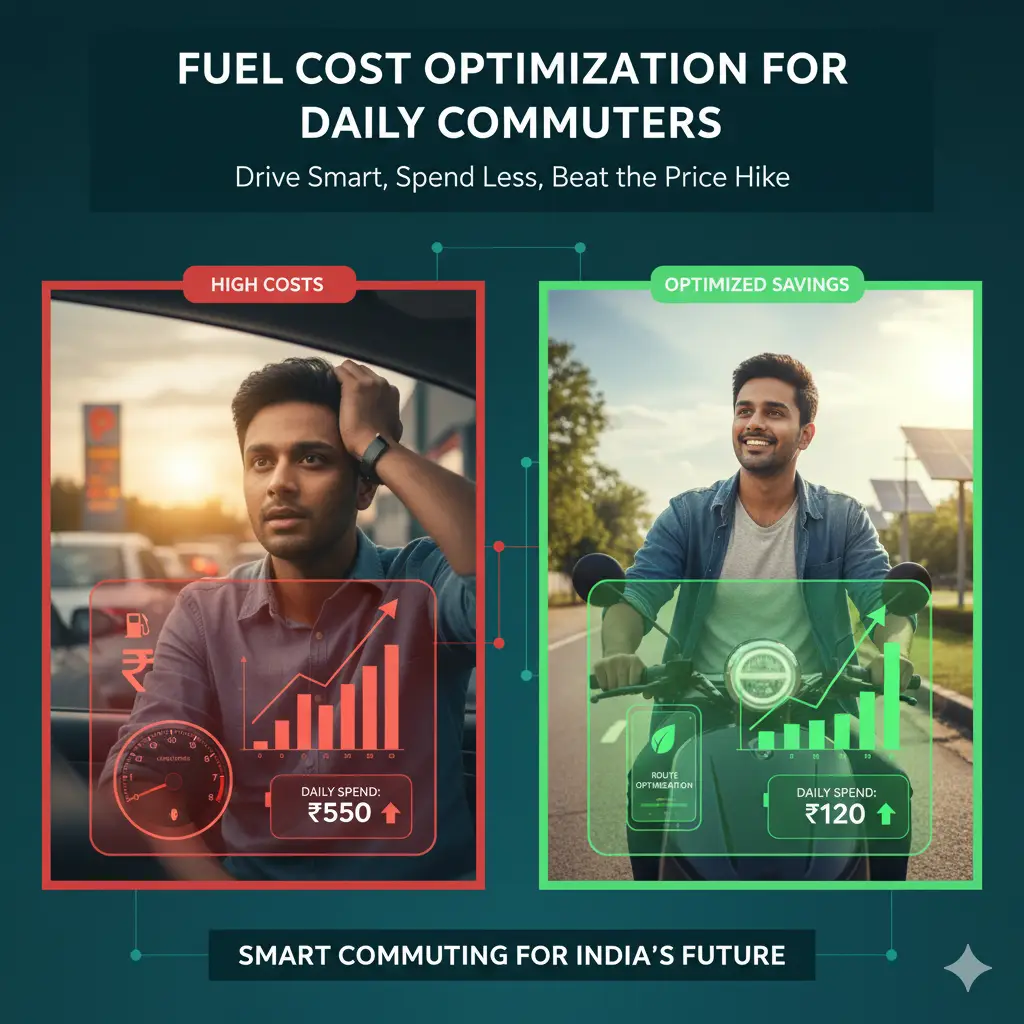
Fuel Cost Optimization for Daily Commuters in India — Save ₹5,000/Month
📘 Fuel Costs — India’s Invisible Monthly Bill
Fuel costs are the second-largest variable expense for most Indian households owning a vehicle — after groceries. With petrol at ₹100-110/litre and diesel at ₹88-95/litre across major Indian cities in 2026, a typical working professional commuting 30 km daily spends ₹5,000-12,000/month on fuel alone. This ₹60,000-1,44,000 annual spend is a genuine wealth-building opportunity: redirecting even 30% of fuel costs savings to a monthly SIP at 13% CAGR grows to ₹35-85 lakh in 20 years. Fuel optimisation is not just about saving money — it is about redirecting a large, often unexamined expense toward long-term financial goals.
📊 India Fuel & Transport Cost Data — 2025-26
- PPAC (Petroleum Planning & Analysis Cell), June 2026: Petrol price range across metros: ₹100.56 (Delhi) to ₹108.34 (Mumbai). Diesel: ₹87.62-95.44. CNG: ₹80-95/kg in major cities. LPG (fuel vehicles): ₹90-105/kg. Auto-gas (LPG for cars): ₹70-85/kg where available.
- SIAM (Society of Indian Automobile Manufacturers), FY 2024-25: Total vehicles on Indian roads: 36 crore. Two-wheelers: 26 crore. Cars: 6.8 crore. EV sales grew 45% YoY: 18.7 lakh EVs sold, of which 85% are two-wheelers.
- IEA India Energy Outlook, 2025: India’s transport sector: 38% of total petroleum consumption. Road transport fuel subsidy removal (2014) means market prices — Indian petrol prices are among Asia’s most transparent to global crude fluctuations.
- QuickRide, 2025: Carpooling platform data: average carpooler saves ₹4,200/month. 85 lakh registered carpoolers in India, growing 32% annually. Carpooling reduces individual fuel cost by 50% and parking cost by 100%.
1. True Monthly Commute Cost — Beyond Just Fuel
Most commuters calculate fuel cost but ignore the true total cost of vehicle ownership. Per-km cost for a petrol car in Indian metros 2026:
| Cost Component | Monthly Amount | Per km (1,500km/mo) |
|---|---|---|
| Fuel (petrol, 15km/L at ₹106) | ₹10,600 | ₹7.07 |
| Insurance (annual ₹18,000) | ₹1,500 | ₹1.00 |
| Maintenance & service | ₹2,000 | ₹1.33 |
| Tyres (annual ₹24,000) | ₹2,000 | ₹1.33 |
| Parking (metro city) | ₹2,500 | ₹1.67 |
| Depreciation (₹8L car, 5yr) | ₹6,667 | ₹4.44 |
| EMI interest (if loan) | ₹3,500 | ₹2.33 |
| Total true cost | ₹28,767 | ₹19.18/km |
At ₹19.18/km, your personal petrol car is the most expensive commute option per kilometre — more than Ola, Uber, or Metro for most distances. This true cost calculation often surprises commuters who only track petrol spend.
2. Petrol vs CNG vs EV — The Numbers for Indian Commuters
| Vehicle Type | Fuel Cost/km | Monthly Fuel (1,500km) | Annual Fuel | vs Petrol Car Saving |
|---|---|---|---|---|
| Petrol car (15 km/L) | ₹7.07 | ₹10,600 | ₹1.27L | Baseline |
| Diesel car (18 km/L) | ₹4.97 | ₹7,450 | ₹89,400 | ₹37,800 saved |
| CNG car (25 km/kg at ₹88) | ₹3.52 | ₹5,280 | ₹63,360 | ₹60,240 saved |
| Electric car (home charge at ₹8/kWh) | ₹1.60 | ₹2,400 | ₹28,800 | ₹98,400 saved |
| Electric two-wheeler | ₹1.00 | ₹1,000 | ₹12,000 | ₹1,14,000 saved |
| Metro (average fare) | ₹2.00 | ₹3,000 | ₹36,000 | ₹91,200 saved |
3. Driving Habits That Cut Fuel Bills 20-30%
No hardware investment needed — just technique changes:
| Habit | Mileage Improvement | Monthly Saving (₹10,600 base) |
|---|---|---|
| Smooth acceleration (no jackrabbit starts) | 15-20% | ₹1,590-2,120 |
| Proper tyre inflation (monthly check) | 3-5% | ₹318-530 |
| Engine off at long stops (1min+) | 5-8% | ₹530-848 |
| AC at 24°C vs 18°C | 8-10% | ₹848-1,060 |
| Highway speed 80 km/h vs 100 km/h | 10-15% | ₹1,060-1,590 |
| Combined improvement potential | 25-35% | ₹2,650-3,710/month |
4. Carpooling — The Highest ROI Commute Strategy
Carpooling with even one colleague on your route immediately halves your effective fuel cost. For a ₹10,000/month fuel spender: carpooling saves ₹5,000/month = ₹60,000/year = ₹11.3 lakh in 10 years at 13% CAGR if invested.
How to Set Up Office Carpooling
- Map your colleagues’ home locations vs office on Google Maps
- Identify colleagues within 3 km of your route — most offices have 5-15 potential carpool partners in range
- Propose a 50-50 fuel cost split (or per-km calculation if routes vary)
- Use QuickRide app (carpooling community) or a WhatsApp group for scheduling
- Alternate driving weeks to share vehicle wear equally
5. Metro + Last-Mile — India’s Cheapest Commute
India’s expanding metro networks make metro + e-scooter/auto combination the cheapest option for distances above 10 km:
| City | Metro Network (2026) | Metro + Auto vs Car Daily | Monthly Saving |
|---|---|---|---|
| Delhi NCR | 391 km (world’s 4th largest) | ₹120 vs ₹450-600 | ₹8,000-12,000 |
| Mumbai | Local + Metro expanding to 336 km | ₹90 vs ₹500-800 | ₹9,000-15,000 |
| Bangalore | 73 km (Phase 3 by 2027) | ₹100 vs ₹400-700 | ₹6,000-12,000 |
| Pune | Metro operational; 33 km | ₹80 vs ₹380-600 | ₹5,600-10,000 |
6. Building a Fuel Budget and Tracking System
Three-step fuel budget system: (1) Track: log every fill-up in Fuelly app or a note — date, litres, odometer, amount. (2) Calculate: monthly km ÷ average fuel efficiency = litres needed × fuel price = monthly budget. (3) Review: if actual spend exceeds budget, identify the week it happened and why (extra trips, highway driving, AC usage).
7. Investing Your Fuel Savings
The compounding case for fuel optimisation — converting savings to wealth:
| Optimisation | Monthly Saving | 10-Year SIP Value (13%) | 20-Year SIP Value |
|---|---|---|---|
| Better driving habits | ₹3,000 | ₹6.7L | ₹32.3L |
| Switch to CNG | ₹5,400 | ₹12.1L | ₹58.2L |
| Carpooling | ₹5,000 | ₹11.2L | ₹53.9L |
| Switch to Metro daily | ₹8,000 | ₹17.9L | ₹86.2L |
| Combined (realistic) | ₹6,000 | ₹13.4L | ₹64.6L |
₹64.6 lakh from driving smarter and taking the metro — without earning a single rupee more. The invisible wealth of optimised daily habits.
🧮 Free Calculators — Use Them Now
No login required. Updated for FY 2025-26.
Frequently Asked Questions
Cheapest commute options ranked by per-km cost in Indian metros (2026): Metro rail: ₹1.5-2.5/km (Delhi Metro, Bangalore Metro, Mumbai Metro — most cost-efficient for medium distances). CNG auto/shared cab: ₹3-5/km (door-to-door, no parking cost). Electric scooter (own vehicle): ₹0.8-1.2/km including charging cost. Petrol two-wheeler: ₹3-4/km including fuel + maintenance. CNG car (own): ₹2-3/km. Petrol car (own): ₹6-10/km including fuel, maintenance, parking, depreciation. Electric car (own): ₹2-3.5/km including charging. For most urban commuters: a combination of metro + last-mile e-scooter is the cheapest option. Owning and driving a petrol car door-to-door is 3-5× more expensive than metro+auto.
Petrol vs CNG monthly savings calculation for a 1,500 km/month commuter (typical for 30 km daily round trip): Petrol car (15 km/L mileage at ₹105/L): 100 litres × ₹105 = ₹10,500/month. CNG car (25 km/kg mileage at ₹85/kg): 60 kg × ₹85 = ₹5,100/month. Monthly saving: ₹5,400. Annual saving: ₹64,800. CNG kit retrofit cost: ₹35,000-55,000 (factory-fit preferred for warranty; aftermarket reduces warranty). Break-even: 6-10 months. CNG availability: strong in Delhi NCR, Mumbai, Pune, Ahmedabad, Surat, Hyderabad. Limited in Bangalore (PNG network expansion ongoing), Kolkata. Check CNG station density in your commute area before converting.
The EV economics for daily commuting in 2026: Two-wheeler EV (Ola S1, TVS iQube, Bajaj Chetak): ₹90,000-1,40,000 purchase price. Charging cost: ₹0.8-1.2/km. Petrol scooter equivalent cost: ₹3-4/km. Monthly saving on 800km commute: ₹1,700-2,700. Payback period: 3-4 years vs petrol equivalent. Four-wheeler EV (Tata Nexon EV, MG ZS EV): ₹15-25L. Charging cost: ₹1.5-2.5/km home charging. Petrol equivalent: ₹8-12/km total cost. Monthly saving: ₹7,000-12,000 on 1,500km commute. Payback: 5-7 years vs petrol equivalent. Key consideration: home charging availability (own flat with parking = viable; apartment with no dedicated charging = significant inconvenience).
Fuel efficiency driving habits with quantified impact: (1) Smooth acceleration and braking: aggressive driving reduces mileage by 20-30%. City driving style change alone can improve mileage from 12 to 15 km/L (25% improvement). (2) Tyre pressure: properly inflated tyres improve fuel efficiency by 3-5%. Under-inflated by 10 PSI: 3.3% more fuel. Check monthly — petrol stations check for free. (3) Air conditioning: AC at 18°C reduces efficiency by 12-15%. AC at 24°C with fan high reduces by 5-7%. Each degree warmer you set the AC: 2-3% fuel saving. (4) Idling: engine idling burns 0.3-0.6 litres/hour. Turn off engine for stops above 1 minute — especially at railway crossings (India averages 4-8 minutes). (5) Speed: optimal fuel efficiency for most Indian cars: 60-80 km/h. Highways at 100 km/h: 10-15% more fuel than 80 km/h.
Fuel expense tracking and reduction system: (1) Fuelly or similar app: log every petrol fill — litres filled, odometer reading, amount paid. App calculates actual km/L over time. Variance from expected mileage = engine or tyre issue needing attention. (2) Monthly fuel budget: calculate your monthly km driven × fuel cost per km. Set this as a hard budget cap. Track against it weekly. (3) Fuel timing strategy: fill petrol in the morning (cooler temperatures = slightly denser fuel = marginally more energy). Fill before Tuesdays (state-wise price revision on Tuesdays in some states). Fill at higher-throughput stations (fresher stock, less air in tanks). (4) Carpooling: one carpooling partner sharing your daily commute = 50% fuel cost split = ₹2,500-5,000/month saving. Apps: QuickRide, BlaBlaCar Daily, WhatsApp community of area colleagues.