
Understanding Risk
in Mutual Funds
Types of mutual fund risk, the SEBI risk-o-meter, how to assess your risk appetite, how time horizon reduces risk, and what to do when your fund’s NAV falls — the complete risk guide.
Risk Is Not the Enemy — Misunderstanding Risk Is
Most first-time investors think of risk as “I might lose money” — and so they avoid equity mutual funds, putting money in FDs and savings accounts instead. But avoiding equity risk creates a different risk: inflation risk, which silently erodes purchasing power at 6% per year. Understanding the full spectrum of mutual fund risks — and how to manage them — is what separates confident investors from anxious ones.
Types of Mutual Fund Risk
| Risk Type | Definition | Most Affected Funds | How to Mitigate |
|---|---|---|---|
| Market Risk | NAV falls when equity markets fall | All equity funds | Long investment horizon; SIP for averaging |
| Credit Risk | Bond issuer defaults on payment | Debt funds with lower-rated bonds | Choose funds with AAA/AA+ rated portfolios |
| Interest Rate Risk | Bond prices fall when rates rise | Long-duration gilt and bond funds | Match fund duration to investment horizon |
| Liquidity Risk | Difficulty selling units at fair price | Small-cap, sectoral, small-AMC funds | Choose large, well-traded funds |
| Inflation Risk | Returns fail to beat inflation | Liquid funds, savings accounts, low-rate FDs | Maintain equity allocation for long-term goals |
| Concentration Risk | Over-exposure to one sector/stock | Sectoral and thematic funds | Diversify across sectors and market caps |
| Fund Manager Risk | Poor performance or manager departure | Actively managed equity funds | Index funds (no manager risk) or diversify AMCs |
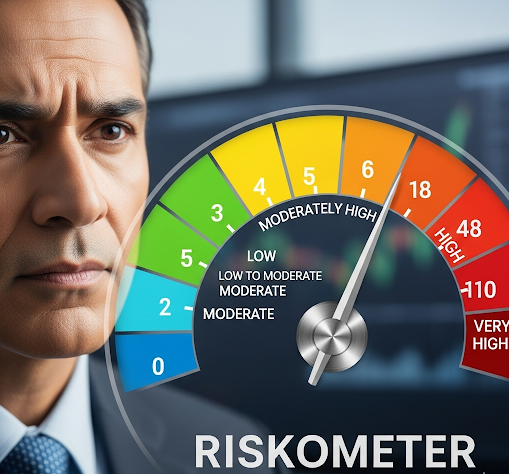
The SEBI Risk-O-Meter — Reading Your Fund’s Risk
SEBI’s mandatory risk-o-meter categorises every fund on a 6-point scale updated monthly. Understanding where your fund sits:
| Risk Level | Colour | Typical Fund Types | Appropriate For |
|---|---|---|---|
| Low | Dark Blue | Overnight funds, liquid funds | Emergency fund, parking short-term cash |
| Low to Moderate | Blue | Ultra short, low duration debt | 3-6 month savings goals |
| Moderate | Yellow | Corporate bond, balanced hybrid | 2-4 year goals, moderate risk tolerance |
| Moderately High | Light Orange | Balanced advantage, large-cap | 5+ year goals, moderate-high tolerance |
| High | Orange | Flexi-cap, mid-cap, aggressive hybrid | 7+ year goals, higher risk tolerance |
| Very High | Red/Brown | Small-cap, sectoral, thematic | 10+ year goals, high risk tolerance, partial allocation only |
Risk Appetite Assessment Framework
Your appropriate risk level is determined by three factors working together:
1. Risk Capacity (What You Can Afford)
- Emergency fund: 6+ months of expenses in liquid instruments? High risk capacity
- Income stability: Government or large corporate job = higher capacity; freelance/business = lower
- Dependents: Single with no dependents = higher capacity; family with young children = lower
- Debt obligations: No high-interest debt = higher capacity
2. Risk Tolerance (What You Can Handle Emotionally)
The crash test question: If your Rs 10 lakh investment falls to Rs 7 lakh in 6 months (a 30% correction — which happens), would you: (A) Increase investment — Very High tolerance; (B) Stay invested and continue SIP — High tolerance; (C) Feel anxious but stay put — Moderate tolerance; (D) Reduce or stop SIP — Low tolerance; (E) Redeem immediately — Very Low tolerance. Your honest answer determines your real risk tolerance (not your stated one).
3. Risk Requirement (What Your Goal Needs)
A goal 2 years away cannot afford high risk regardless of your tolerance — the market may not recover in time. A goal 20 years away can and should take high equity risk — the long time horizon absorbs market cycles. Match risk to the goal timeline, not just personal preference.
How Time Reduces Equity Risk
Historical analysis of Nifty 50 SIP returns across different holding periods shows a dramatic narrowing of return range with time:
| Holding Period | Worst Return | Best Return | Probability of Positive Return |
|---|---|---|---|
| 1 Year | -55% | +110% | ~68% |
| 3 Years | -20% | +40% | ~78% |
| 5 Years | -10% | +30% | ~87% |
| 7 Years | +1% | +24% | ~95% |
| 10 Years | +6% | +22% | ~99% |
| 15 Years | +10% | +20% | ~100% (historically) |
Over 15+ years, the probability of negative returns from diversified Indian equity funds has been essentially zero. Time is the most powerful risk management tool available — and it is free.
Diversification — The Only Free Lunch in Investing
Diversification reduces risk without proportionally reducing returns — which is why economists call it the “only free lunch in investing.” How to diversify effectively:
- Within equity: Spread across 50-100 stocks through diversified funds (not concentrated sectoral bets)
- Across market caps: Large-cap stability + mid-cap growth + small-cap upside
- Across asset classes: 70% equity + 20% debt + 10% gold reduces portfolio volatility significantly
- Across geographies: Adding international index funds (US S&P 500) provides currency diversification and exposure to global growth
- Across time: SIP invests at different market levels — time diversification reduces entry point risk
What To Do When Markets Crash
Market corrections of 20-40% happen roughly every 3-5 years in India and are completely normal. The investor who stays the course during crashes and even increases investment comes out far ahead of the investor who panics and redeems.
- Continue SIP without interruption — you buy more units at lower prices
- Resist the urge to check portfolio daily during corrections
- Do not redeem unless you have a specific near-term financial need
- Consider lump-sum top-up if you have surplus cash during a significant correction
- Review asset allocation — if equity has fallen below target %, this is the right time to rebalance
- Distinguish between temporary market risk (macro/systemic) and permanent fund-specific issues (fraud, consistently poor management)
🧮 Free Calculators — Use Them Now
No login required. Updated for FY 2025-26.
Frequently Asked Questions
Mutual fund risk has multiple dimensions: (1) Market risk — NAV falls when markets fall; affects all equity funds; (2) Credit risk — bond issuer defaults; affects debt funds holding lower-rated bonds; (3) Interest rate risk — bond prices fall when interest rates rise; affects long-duration debt funds; (4) Liquidity risk — difficulty selling units quickly without price impact; affects sectoral or small-cap funds; (5) Inflation risk — returns do not beat inflation; affects low-return debt instruments; (6) Concentration risk — too much in one sector or company; (7) Fund manager risk — poor performance or departure of key fund manager in active funds.
SEBI mandates that every mutual fund scheme display a risk-o-meter — a colour-coded dial showing risk level from Low (green) to Very High (red). The 6 levels are: Low, Low to Moderate, Moderate, Moderately High, High, and Very High. Liquid funds are typically Low; large-cap index funds are Moderate to Moderately High; mid-cap and small-cap funds are High to Very High; sectoral funds are Very High. The risk-o-meter must be updated monthly and displayed on all scheme documents. Always check the risk-o-meter before investing in any mutual fund.
Risk appetite assessment involves three dimensions: (1) Risk capacity — how much financial risk you can absorb without affecting your lifestyle (depends on income stability, emergency fund, dependents, existing investments); (2) Risk tolerance — psychological comfort with seeing portfolio value fall (how would you react to a 30% drop in portfolio value?); (3) Risk requirement — how much risk you need to take to achieve your financial goal given your time horizon (a goal in 2 years needs low risk; a 20-year goal can absorb high risk). Most investors overestimate their risk tolerance until they experience a real market crash. Start with moderate risk and adjust based on actual experience.
Time horizon is the most important factor in determining appropriate mutual fund risk. In equity markets, short-term (1-3 year) SIP returns can range from -20% to +60% — highly unpredictable. Over 7-10 years, the range narrows dramatically and negative returns become rare. Over 15+ years, the probability of positive returns from diversified equity funds approaches near-certainty historically. This is why financial planners say equity risk reduces with time. For short-term goals (under 3 years), use low-risk debt funds regardless of your risk tolerance. For long-term goals (7+ years), equity risk is not just acceptable but necessary to beat inflation.
Diversification reduces risk by spreading investments across multiple assets that do not move in perfect correlation. Within equity: a diversified equity fund holding 50-100 stocks reduces single-stock risk dramatically — a single company going bankrupt affects the portfolio by 1-2%, not 100%. Across asset classes: combining equity, debt, and gold funds in a portfolio reduces volatility because they often move in different directions — gold often rises when equity falls. Across market caps: combining large-cap (stability), mid-cap (growth), and small-cap (higher returns) balances the portfolio. The key: over-diversifying beyond 4-5 funds in a portfolio creates complexity without additional risk reduction.
When NAV falls sharply, the instinctive reaction is to panic and redeem — which is almost always the wrong decision. The right actions: (1) Do not redeem unless the financial goal is immediate (within 1-2 years); (2) Continue or increase SIP — you are buying more units at lower prices (Rupee Cost Averaging benefit); (3) Review whether the fall is market-wide or fund-specific — if the fund has underperformed its benchmark and peers consistently for 3+ years, consider switching; (4) Rebalance portfolio if equity allocation has fallen below target — use it as an opportunity to deploy additional funds into equity; (5) Remember historical pattern: every major Indian market correction has been followed by strong recovery within 2-4 years.