
Dynamic Asset Allocation in Volatile Markets — India 2026 Complete Guide
📘 Dynamic Asset Allocation — Automatic Valuation-Based Investing
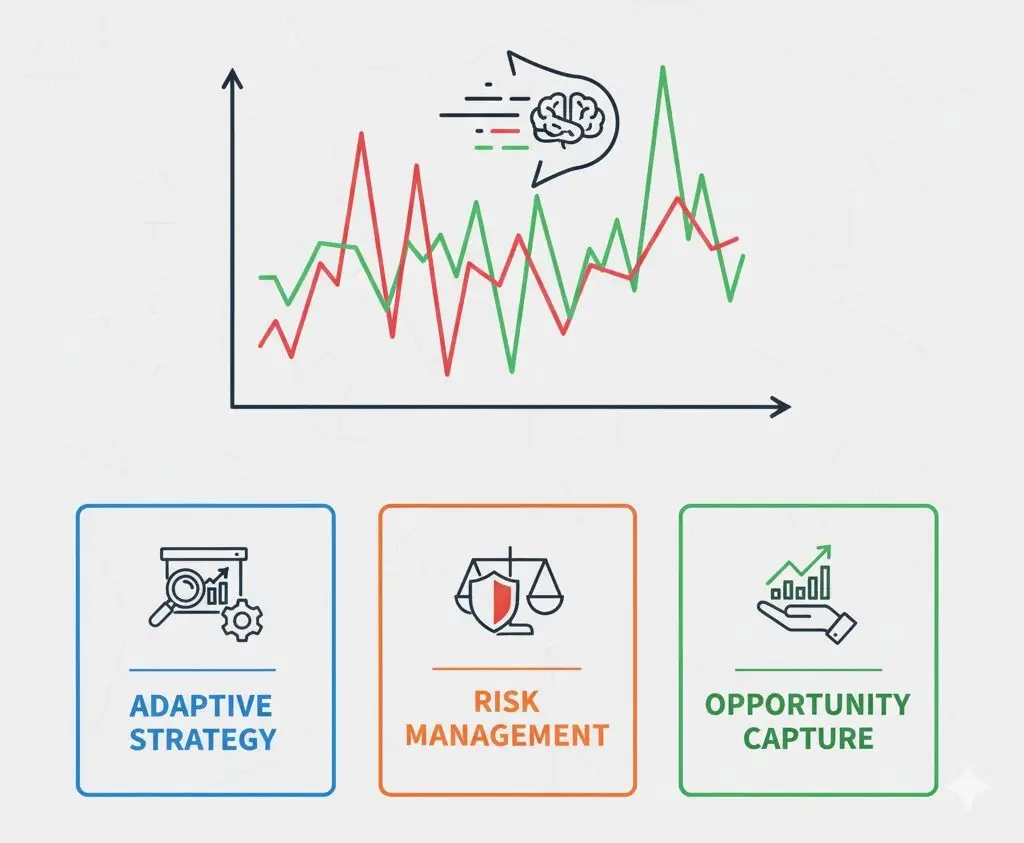
Dynamic Asset Allocation (DAA) is the investment strategy of adjusting equity and debt proportions based on market valuations — increasing equity when markets are cheap and reducing when expensive. In practice, individual investors struggle to execute this systematically (emotional bias causes buying at peaks and selling at bottoms). Balanced Advantage Funds (BAF) — SEBI-regulated hybrid funds — automate this process using quantitative models, giving investors an automatic valuation-aware portfolio that reduces the behavioural errors that cost Indian retail investors 2-4% annually in forgone returns.
📊 DAA Fund Market Data — AMFI 2025-26
- AMFI, March 2026: Balanced Advantage Fund category AUM: ₹2.8 lakh crore — India’s largest hybrid MF category. 28 funds in the category. Growing at 32% YoY as investors seek volatility-managed products.
- SEBI, 2026: BAF funds maintained average equity allocation of 58% in FY 2024-25 (bull market) vs 71% in April 2020 (crash) — demonstrating the valuation-based allocation shift in practice.
- AMFI 5-year data: Top DAA/BAF funds delivered 11-13% CAGR over 5 years with maximum drawdowns of 15-22% — significantly lower than pure large-cap equity funds (max drawdown 35-42%) over the same period.
- Behavioural Finance Research, 2025: Retail investors who held BAF funds through 2020 COVID crash retained 85% more value than investors who switched out of pure equity funds at the bottom.
1. How Dynamic Asset Allocation Works
The core logic: equity is more attractive when it is cheap (low P/E, low P/B) and less attractive when expensive. A DAA strategy continuously measures valuation metrics and shifts allocation accordingly.
| Market Condition | Typical Valuation Signal | DAA Action | Equity Allocation |
|---|---|---|---|
| Extreme undervaluation (crash) | Nifty P/E below 16 | Maximum equity buy | 75–80% |
| Undervalued (correction) | Nifty P/E 16–20 | Increase equity | 65–75% |
| Fair value | Nifty P/E 20–24 | Neutral position | 55–65% |
| Overvalued (bull run) | Nifty P/E 24–28 | Reduce equity | 40–55% |
| Extreme overvaluation (bubble) | Nifty P/E above 28 | Minimum equity | 30–40% |
This systematic, emotion-free allocation shift means the fund is naturally buying more equity after market crashes — when fear-driven retail investors are selling — and reducing equity during euphoria. This is exactly the “buy low, sell high” that investors aspire to but consistently fail to execute manually.
2. BAF Allocation Models — P/E vs P/B vs Composite
Different fund houses use different valuation metrics for their equity allocation model:
| Fund | Model Used | Key Metric | Rebalancing Frequency |
|---|---|---|---|
| HDFC Balanced Advantage | Price-to-Book (P/B) | Nifty 50 P/B ratio | Monthly |
| ICICI Pru Balanced Advantage | Composite (P/E, P/B, dividend yield) | Multi-factor composite | Daily trigger-based |
| Nippon India Balanced Advantage | Price-to-Earnings (P/E) | Nifty 50 trailing P/E | Monthly |
| Kotak Balanced Advantage | Composite proprietary model | Multiple valuation factors | Ongoing |
| DSP Dynamic Asset Allocation | Equity risk premium model | Equity yield vs bond yield | Monthly |
3. Best DAA/BAF Funds in India 2026
| Fund | 5yr CAGR | Max Drawdown | Expense (Direct) | AUM |
|---|---|---|---|---|
| HDFC Balanced Advantage Fund | 13.2% | -19% | 0.72% | ₹92,000 Cr |
| Kotak Balanced Advantage Fund | 12.8% | -17% | 0.53% | ₹18,000 Cr |
| Nippon India Balanced Advantage | 12.1% | -22% | 0.85% | ₹8,200 Cr |
| ICICI Pru Balanced Advantage | 11.9% | -16% | 0.92% | ₹56,000 Cr |
| Edelweiss Balanced Advantage | 12.4% | -15% | 0.40% | ₹12,000 Cr |
Look for: consistent 3-5 year performance, lower max drawdown (capital preservation), lower expense ratio (direct plan), and clear disclosure of the allocation model. HDFC BAF’s large AUM (₹92,000 Cr) demonstrates strong investor trust; Edelweiss and Kotak offer lower expense ratios with competitive returns.
4. DAA vs Static 60-40 Portfolio
Comparison over a volatile period (FY 2020-2026 including COVID crash and recovery):
| Portfolio | 6yr CAGR | COVID Crash Drop | Annual Rebalancing Effort | Tax Events |
|---|---|---|---|---|
| Pure Nifty 50 Index Fund | 15.2% | -38% | Zero | On redemption only |
| Static 60-40 (equity + debt) | 11.8% | -24% | Annual rebalancing | On annual rebalancing |
| HDFC Balanced Advantage Fund | 13.2% | -19% | Zero (automatic) | On redemption only (equity tax) |
DAA/BAF fills the middle ground: better risk-adjusted return than pure equity (lower crash), better pure return than static balanced (dynamic equity increase in crashes), and zero manual rebalancing effort with equity fund taxation.
5. DIY Dynamic Allocation — Without a Fund
For investors who prefer managing their own allocation: implement a simple rule-based DAA strategy using Nifty 50 P/E ratio (publicly available on NSE website daily):
| Nifty 50 P/E Range | Your Equity % | Debt % | Action |
|---|---|---|---|
| Below 18 | 80% | 20% | Increase equity aggressively |
| 18–22 | 70% | 30% | Maintain or slightly increase |
| 22–26 | 60% | 40% | Target allocation — no change |
| 26–30 | 50% | 50% | Begin reducing equity |
| Above 30 | 35–40% | 60–65% | Significant equity reduction |
Check once a month. Rebalance only if allocation has moved by 5%+ from the above target. This simple rule-based approach captures most of the DAA benefit without a fund’s expense ratio — but requires discipline to execute (buying more equity when markets are falling and you’re fearful).
6. Investor Behaviour During Volatility
The biggest enemy of investment returns is not market crashes — it is investor behaviour during crashes. Research consistently shows:
- Average equity MF investor return vs fund return (DALBAR India, 2025): 3-4% annual gap — because investors buy after markets rise and sell after markets fall, reducing their effective holding period and worsening entry/exit prices.
- The COVID lesson: Investors who stopped SIP in March 2020 (market down 38%) missed the recovery — Nifty returned to pre-crash levels by August 2020 and delivered 80%+ returns by December 2021. Those who held through earned full recovery; those who sold locked in losses.
- DAA helps behaviour: Knowing the fund automatically increases equity during crashes (and you don’t have to make the scary decision to buy more) helps investors stay invested. The fund “does the right thing” even when investors feel like doing the wrong thing.
7. Who Should Invest in DAA Funds?
| Investor Type | DAA/BAF Suitability | Reason |
|---|---|---|
| First-time investor, nervous | High | Lower volatility reduces anxiety and dropout risk |
| Retiree needing some equity | High | Automatic downside protection, equity taxation |
| Lump sum investor (market timing anxiety) | High | Fund self-manages valuation risk; no timing stress |
| Long-term (15yr+) disciplined SIP investor | Low | Pure equity index fund typically better at long horizons |
| Aggressive growth seeker | Low | DAA underperforms pure equity in sustained bull markets |
🧮 Free Calculators — Use Them Now
No login required. Updated for FY 2025-26.
Frequently Asked Questions
Dynamic Asset Allocation (DAA) funds — also called Balanced Advantage Funds (BAF) in India — are hybrid mutual funds that automatically adjust their equity-debt ratio based on market valuations. When equity markets are expensive (high P/E, P/B ratios), they reduce equity allocation (sometimes to 30-40%). When markets are cheap (low valuations after a crash), they increase equity allocation (to 70-80%). Unlike static balanced funds (always 60-40), DAA funds act as an automatic valuation-based rebalancer. SEBI requires these funds to maintain 65%+ equity-equivalent exposure (through arbitrage) for equity fund taxation treatment.
Top performing DAA/Balanced Advantage Funds by 5-year CAGR (as of early 2026): HDFC Balanced Advantage Fund (13.2% 5yr CAGR), Kotak Balanced Advantage Fund (12.8%), Nippon India Balanced Advantage Fund (12.1%), ICICI Prudential Balanced Advantage Fund (11.9%), DSP Dynamic Asset Allocation Fund (11.4%). Performance varies by the specific equity allocation model used — some use P/E ratio, others P/B, others proprietary composite indicators. Each fund’s allocation model is disclosed in the SID. HDFC BAF’s model (based on P/B ratios) has been among the most consistent performers.
Dynamic allocation funds are suitable when: (1) You are a risk-averse investor who wants equity-like returns over long periods but cannot emotionally handle 40-50% portfolio drawdowns. (2) You are retired or near-retired and need some equity exposure but with automatic downside protection. (3) You want to invest a large lump sum and are nervous about market timing — DAA funds self-manage valuation risk. Pure equity funds are better when: (1) You have a 15+ year horizon and strong emotional discipline to stay invested through crashes. (2) You understand that temporary deep drawdowns are the price of higher long-term returns. (3) You’re investing via regular monthly SIP — rupee cost averaging handles volatility naturally.
During the March 2020 COVID crash (Nifty fell 38%): typical DAA/BAF funds fell only 15-25% vs 38% for pure equity funds — because they had automatically reduced equity to 35-45% as markets became expensive in 2019-early 2020, then increased equity back to 65-70% as markets crashed, participating in the recovery. This behavioural advantage — reducing equity at peaks, increasing at troughs — is the core value of DAA funds. The limitation: this also means DAA funds underperform pure equity in strong bull markets (they sell equity as markets rise).
Since SEBI requires DAA/BAF funds to maintain 65%+ equity-equivalent exposure (through arbitrage positions that count as equity), these funds qualify for equity mutual fund taxation: LTCG on units held 12+ months: 12.5% on gains above ₹1.25L/year. STCG on units held under 12 months: 20%. This is significantly better than debt fund taxation (slab rate on all gains). So DAA funds offer equity taxation despite having substantial debt exposure — a tax efficiency advantage over manually maintaining a 50-50 equity-debt portfolio with two separate funds.